MS Excel is vastly used worldwide for its data processing capability. We can easily make data charts and tables with the help of this program.
Sometimes when processing data, you may need to show its probability value in the spreadsheet. Considering the P value will make your statistics more solid and dependable. You must find the Probability value if you offer some hypothetical test results on your Excel sheet.
Finding or calculating the P value is a straightforward process. In this article, I will show you 3 different yet functioning ways with which you can easily find your desired P value in Excel.
So don’t skip any part of this article, and let’s get started!
Follow our guide how to Setup Print Area in Excel
What is a P-Value in Microsoft Excel?
The P value, also called the Probability value, is the percentage estimation on a Hypothesis test. You can quickly conclude whether a test is a null hypothesis or not using the p-value. If the percentage of the P value is smaller than 5%, then the possibility of the null hypothesis is significant.
Null Hypothesis
When there is no significant difference between the previous and new data, it is called the null hypothesis. In 1925 Sir Ronald Aylmer Fisher published a fantastic book that indicates that statistical significance is crucial for test methods.
Likewise, with the help of the null hypothesis, you can easily ensure that your hypothetical data is reliable. The null hypothesis is a statement, and the researchers tend to disprove it if they want to establish their findings. H0 denotes the null hypothesis.
How to Find P Value in Excel
There are three methods to find the Probability value in Microsoft Excel. The first is the Data Analysis option, but you must include the Data Analysis function in your Excel Add-ins before using it. The other two methods use the T. TEXT and TDIST formulas.
Here are the steps to find the P value in MS Excel:
1. Use the Data Analysis Option
Using the Data Analysis function to find the P value is a simple yet working method. Let’s find out how you can use the Data Analysis option to calculate the Probability value in MS Excel.
Add the Data Analysis Option on MS Excel
The Data Analysis function is not enabled by default in some Excel programs. If that’s the case with you, you must add that function to your Excel sheet and then apply it to find the P value.
Here are the steps to add the Data Analysis option on MS Excel:
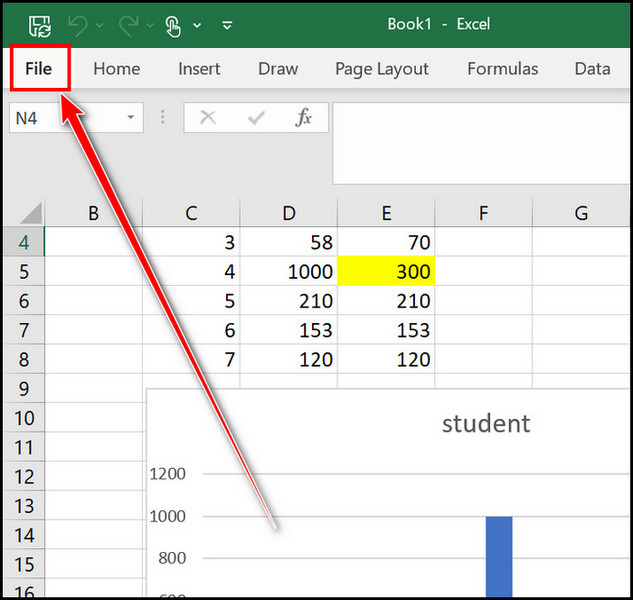
- Launch the MS Excel application.
- Move to the File section.
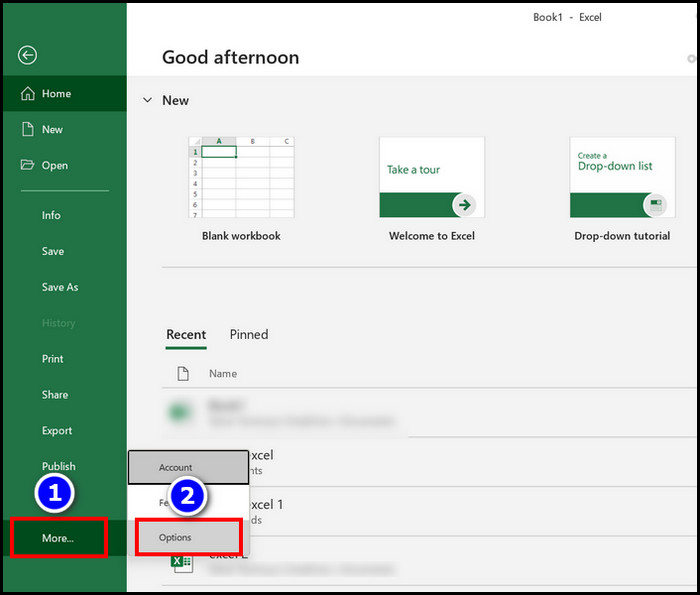
- Navigate to the More > Options menu.
- Move to the Add-ins section.
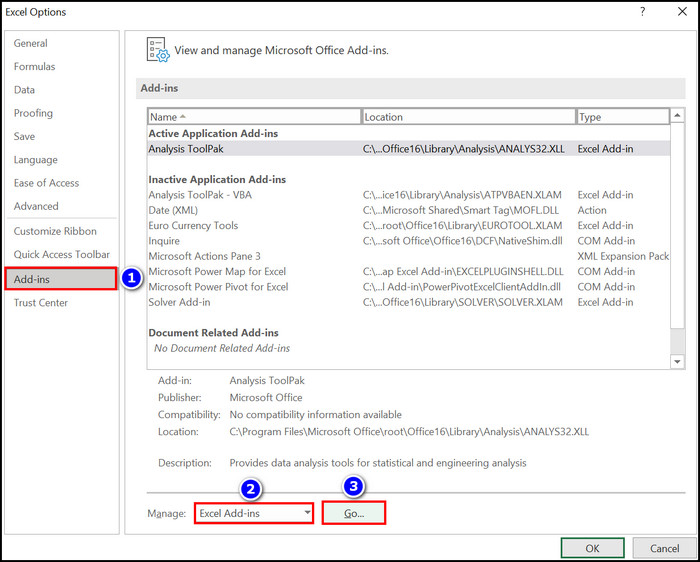
- Select the Excel Add-ins option from the Manage checkbox.
- Hit the Go
- Select and check the Analysis ToolPak option and press the OK key.
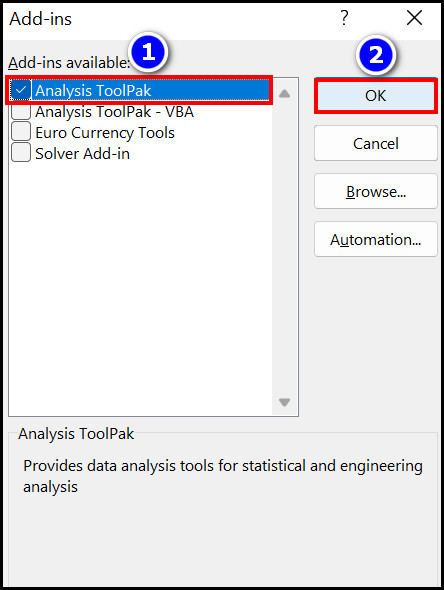
You successfully added the Data Analysis option to your MS Excel sheet.
Read more on how to Break Bar Chart Axis in MS Excel
Apply the Data Analysis Function to Find the P-Value in Excel
After adding the Data Analysis option to your spreadsheet, you can find the P value from your desired charts or tables. Let’s see how to find the Probability value in Excel.
Here are the steps to find the P value using the Data Analysis option:
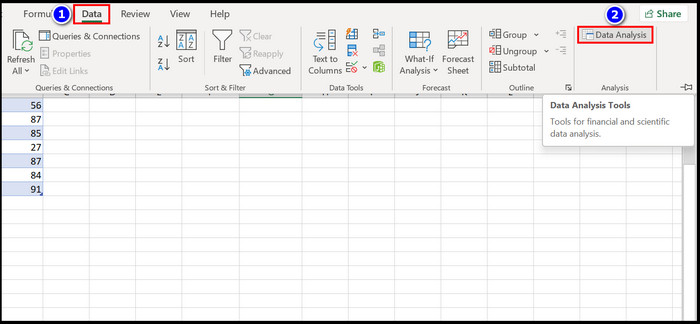
- Navigate to the Data section from MS Excel.
- Select the Data Analysis option.
- Choose the t-Test: Paired Two Sample for Means option from the Analysis Tools dialog box.
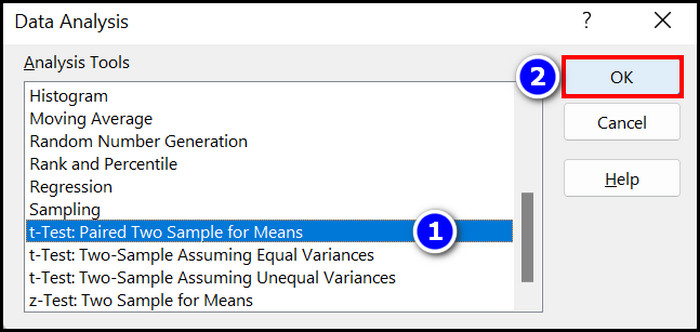
- Click on the OK button.
- Input the Before data range in the Variable 1 Range: box.
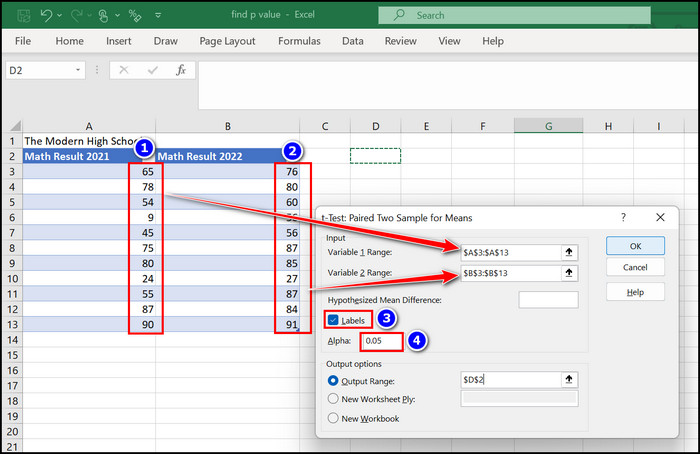
- Select the After data range for the Variable 2 Range: box.
- Enable the Labels checkbox, and the Alpha box should remain as it appears, such as .05.
- Choose cells from your spreadsheet where you want to see your Output; for that, check and select the Output Range: option.
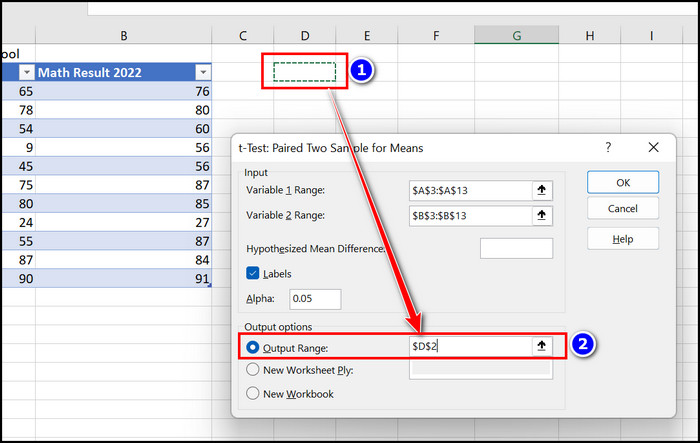
- Hit the OK button after all the above modification is done.
Instantly you will see a detailed chart on your computer screen; among them, you can easily find your desired Probability value. To understand this segment more clearly, you can follow my given pictures.
Check out our separate post on how to MS Excel Lock a Cell
2. Apply the T.TEST Formula
You can easily find your desired P value using the T.TEXT formula. Applying the Data Analysis option to find the Probability value will give you several vital pieces of information.
But while you use the T.TEST formula, you will not get any extra information. Just the primary Probability value will appear on the selected cell.
Before jumping into the steps, let’s see the T.TEST formula:
=T.TEST(array1,array2,tails,type)
Array1: Previous data
Array2: New data
Tails: Number of distribution tails (1 or 2 tails)
Type: T. Test types such as (1= paired, 2= two samples equal variance etc.)
Here are the steps to apply the T.TEST formula to find the P value:
- Open the Microsoft Excel program.
- Create your desired chart.
- Select an empty cell where you want to see the P value.
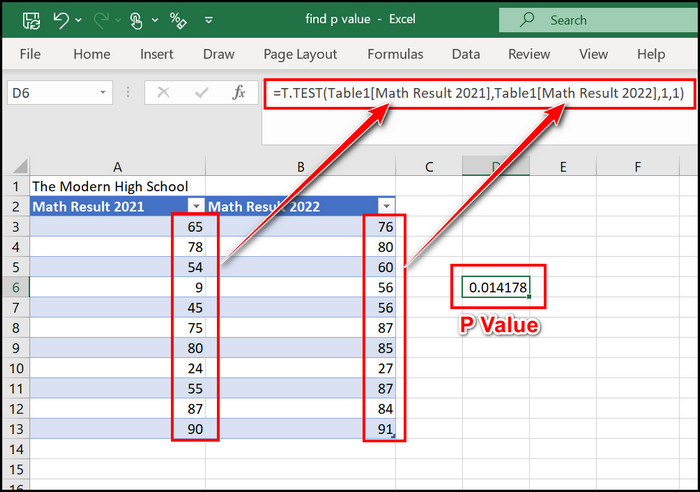
- Type =T.TEST( and select the previous data section in the array1 and complete it with a comma at the end. For me, it is =T.TEST(Table1[Math Result 2021],
- Select the new data section in array2 and place a comma; in my sheet, it is =T.TEST(Table1[Math Result 2021],Table1[Math Result 2022],
- Choose 1 for one-tailed distribution and 2 for two-tailed distribution; then put a comma.
- Select 1 for paired value then close the bracket.your formula will look like this =T.TEST(Table1[Math Result 2021],Table1[Math Result 2022],1,1)
- Hit the Enter button.
The required P value has appeared on the selected cell.
Here’s a complete guide on how to Lock and Unlock Cells in Excel
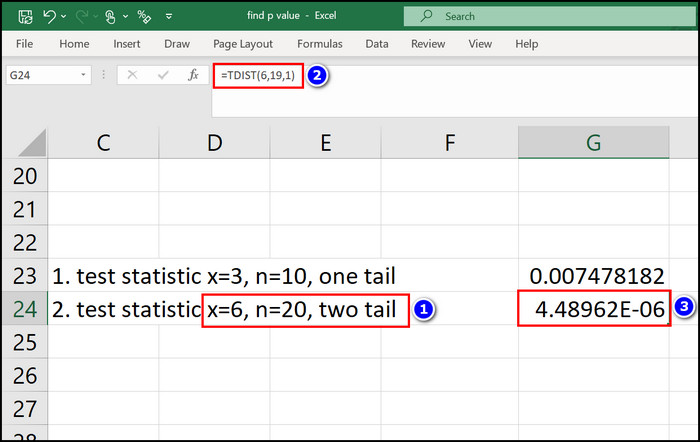
3. Use the TDIST Formula to Find the P-Value in an Excel Tail Test
If you want to determine the P-value from a stated tail test, you can use the TDIST formula. Below I stated the formula for your assistance and defined the used terms.
Formula: =tdist(x,deg_freedom,tails)
X: Test statistics that are given for a specific text.
Deg_freedom: The degree of freedom in my case, it is n-1.
Tails: Select 1 for one tail test and 2 for two-tail tests.
Here are the steps to use technology to find the P value in Microsoft Excel:
- Open the Excel program.
- Note down what your given x and deg_freedom value is.
- Select a specific cell.
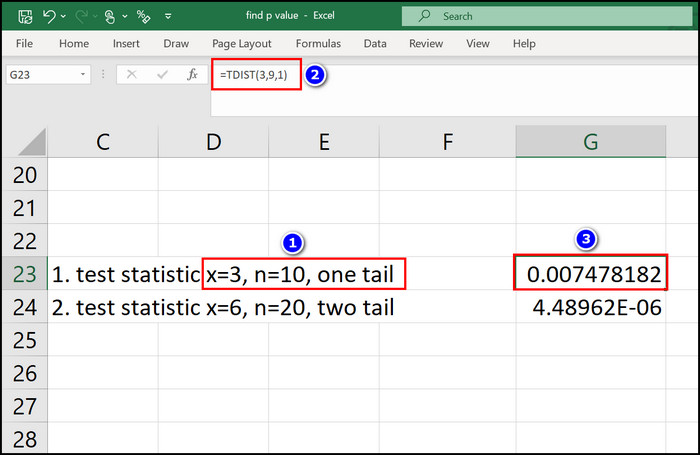
- Type =tdist(x,deg_freedom,tails) for me those are =TDIST(3,9,1) and =TDIST(6,19,2).
- Press the Enter key.
Immediately you will notice that the probability value arises on that formula cell.
Follow our guide on how to Mail Merge in Outlook with Excel & Word.
FAQs
What is the formula to find the p-value in MS Excel?
The formula to find the Probability value on Excel is = P(TS ts | H 0 is true) = cdf(ts) also you can use the =T.TEST(array1,array2,tails,type) formula.
How do I test statistical significance in Excel?
If you want to find the P value, move to the Data section, then select the Data Analysis option. Set the data and hit the OK button.
Why do we use a 0.05 level of significance in MS Excel?
We use the 5% or the .05 level of significance because some verified mediums like the Wide Web and Academia repeatedly promote and denote this number.
Wrapping Up
Finding the P value in Microsoft Excel is a forthright process. You can use several methods to complete this operation.
With the help of the Data Analysis option, you can quickly sort out the probability value. Also, the T.TEXT and TDIST formulas can help you to find your desired P value. Overall, if you read this article thoroughly, you can clearly understand the Probability value and its calculation.
Do you have questions related to this article? Let me know in the comment as I am always eager to answer.