A Gantt chart visually shows the planning of a project. It has a list of tasks to be completed on the vertical axis and a time limit on the horizontal axis.
Henry Gantt created this chart in 1910 for systemic and routine activities for his employees. And still, to this day, the Gantt chart is one of the most widely used management tools for project scheduling and control.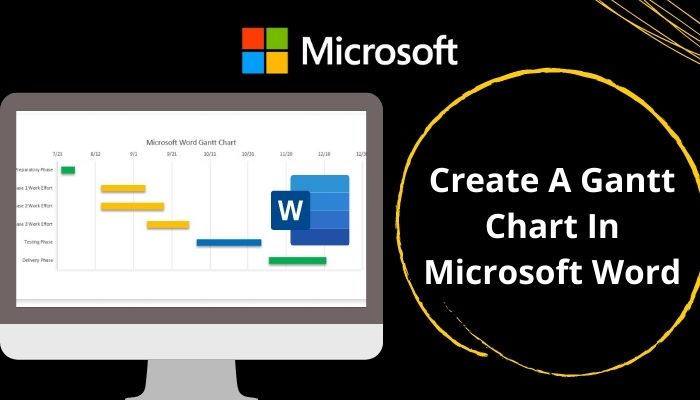
In this article, I’ve created a Gantt chart in Microsoft Word and have described every step of the process thoroughly. I’ve also explained how you can customize your Gantt chart to make it stand out.
So, without further ado, let’s begin!
What is a Gantt Chart?
A Gantt chart graphically represents your task completion of a project on a timeline using horizontal bars. On the left column, it shows your activities, and on the top row, it has the appropriate time scale to complete each activity.
Different horizontal bars represent different activities. The place and size of the bar show the start, duration, and end time of the task.
With the help of the Gantt chart, we can instantly find out:
- What the different tasks are.
- The starting time and ending time of each task.
- The duration of each task is planned to last.
- The time when one task intersects with the other.
- The duration of the whole project.
In short, a Gantt chart represents what to do and when to do it.
Check out our separate post on how to Fix: Microsoft Word Table Of Contents Not Updating.
When Would You Need a Gantt Chart?
Usually, CEOs, managers, marketing teams, administrators, and team leads use Gantt charts because it helps to secure adequate and efficient project supervision.
For instance, if you are managing a team or manufacturing a product, you can make a Gantt chart that shows the whole project that is divided into manageable small tasks. It also indicates when to complete each task.
It summarizes the complete project and improves communication in the manufacturing period, especially for the tasks that are linked to one another.
Here’s when you need the Gantt chart the most:
- When your task has a hard and fixed time limit.
- When various people are working on the same project, you need to coordinate them.
- When you need to show a visual timeline of your project from start to finish.
- When tasks should be done in a particular order.
- When you need to divide the workload among your team members.
- To have an idea of how long the project will take.
Read more on Microsoft Word Read Aloud Stopped Working.
How to Create Gantt Chart in Microsoft Word
Although a Gantt chart represents your project in a simple way, creating it is not as simple. However, Microsoft Word makes it a lot easier for us.
Let’s make a Gantt chart in MS Word from scratch.
Here’s how to create a Gantt chart in Microsoft Word:
1. Prepare a Microsoft Word Page
In this step, you will just prepare a Word document suited for a Gantt chart.
Here are the steps to prepare a Word document to be converted into a Gantt chart:
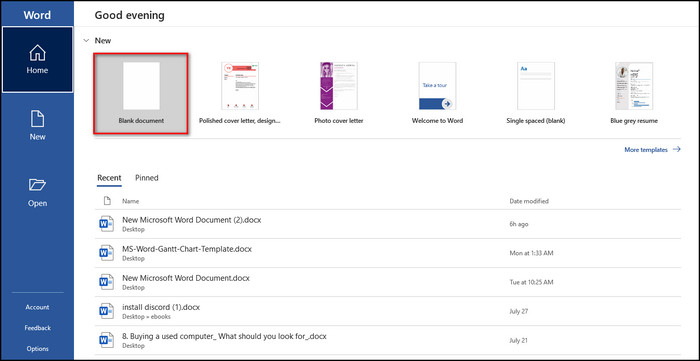
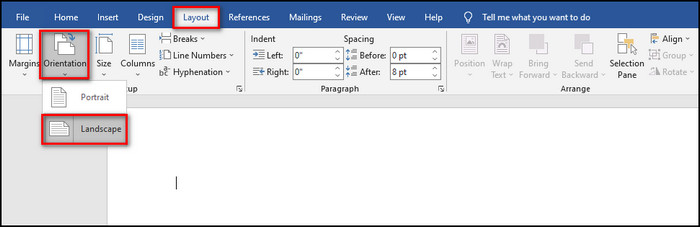
- Launch Microsoft Word.
- Choose a Blank document.
- Move to the Layout tab.
- Select Orientation from the toolbar and choose Landscape.
Also related: how to Unlock Selection in Word.
2. Make a Stacked Bar Graph
When the Word document is ready for a Gantt chart, it’s time to create the graph. And thankfully, Word automatically opens Excel when you make the graph for an easy data entry process.
Here’s how to create a stacked bar graph:
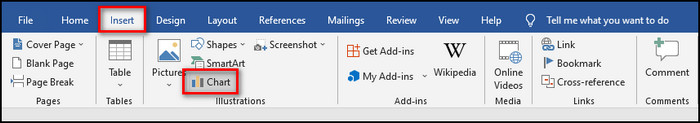
- Go to the Insert tab of the prepared Word document.
- Select Chart from Illustrations in the toolbar.
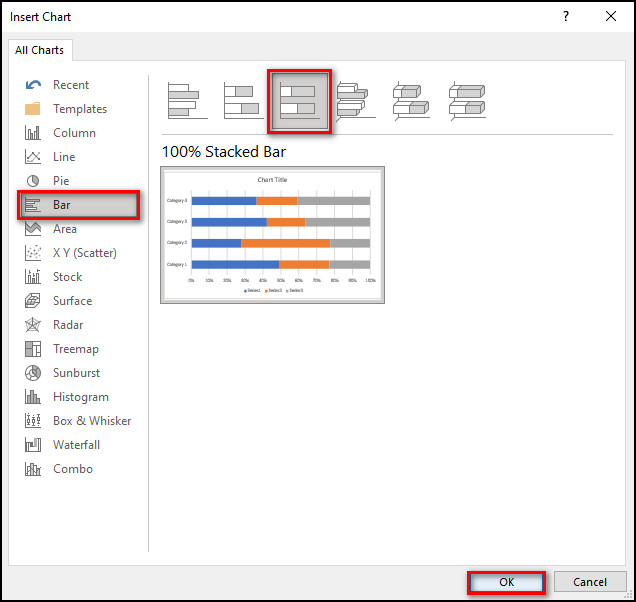
- Choose Bar from the left sidebar, select Stacked Bar and click OK.
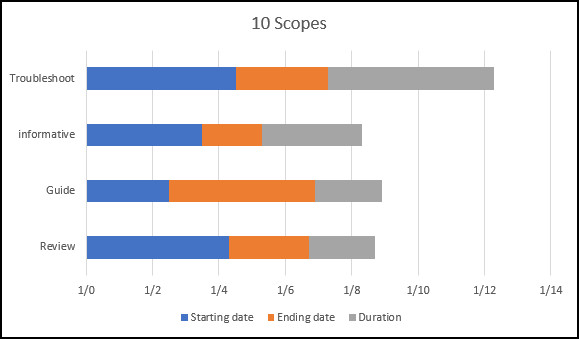
After these steps, a stacked bar will be created, and a Microsoft excel sheet will open containing the data in the stacked bar graph. 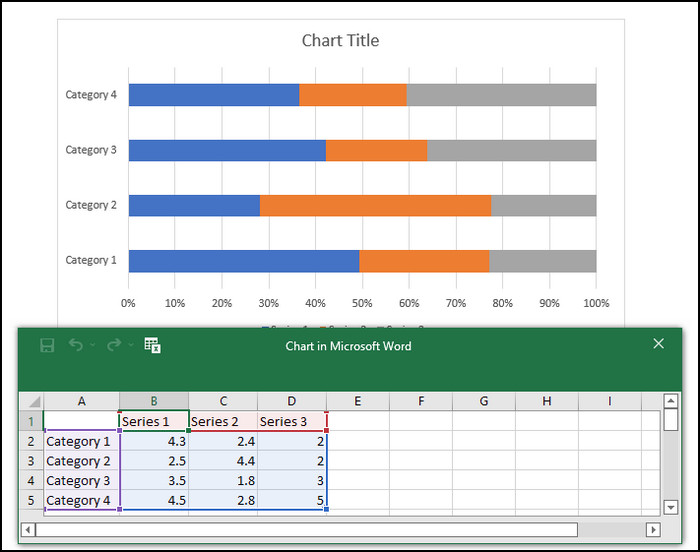
If the Excel sheet disappears, right-click on the graph, select Edit Data > Edit Data in Excel, and the document will open again.
Check out our separate post on Fix Export to PDF Error in Word.
3. Insert Project Schedule & Data into Excel
At this stage, you need to edit the Excel that opened automatically when you created the stacked bar graph.
Here’s how to put the Gantt chart data in Excel:
- Open the Excel sheet and write each task name into column A.
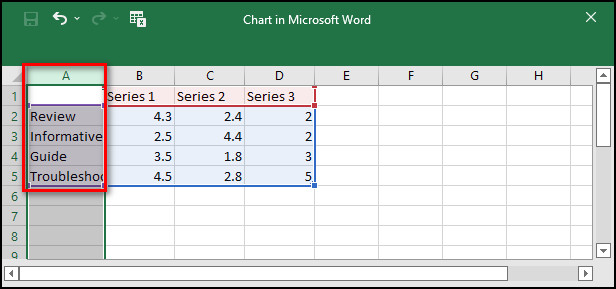
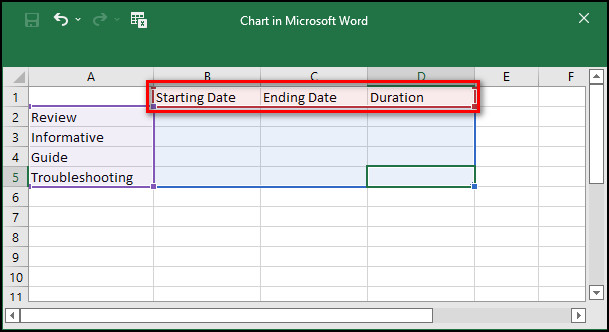
- Change the names of the first row, which is by default Series 1, Series 2, and Series 3. Rename them according to the timeline you want to set for your project.
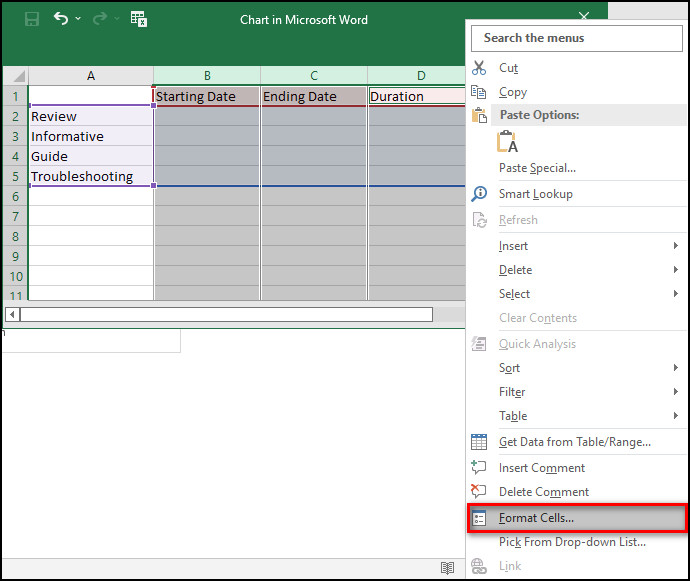
- Change the format of your data so that it shows the correct information. Select the columns you want to change the format, right-click and choose Format Cells.
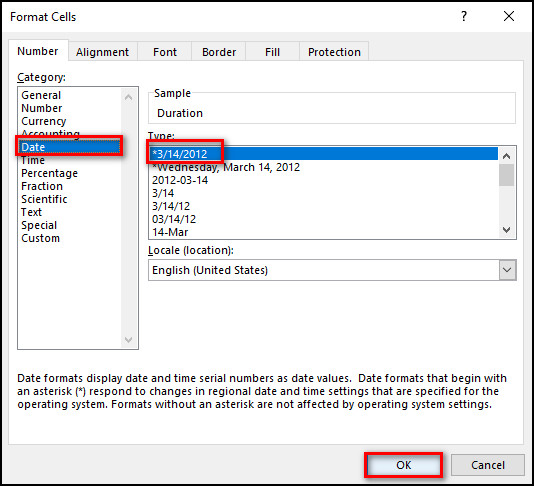
- Select Date under Category and choose the Type you like.
- Insert the data for each column.
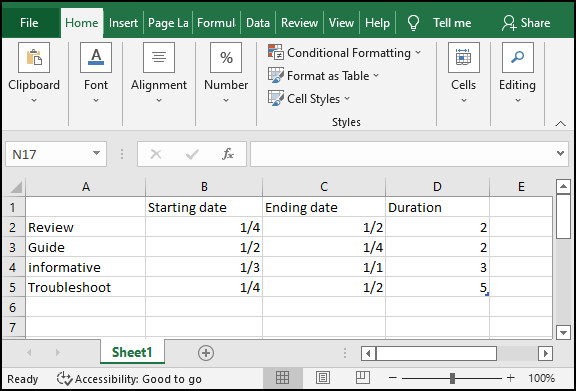
- Open the Word document, and the data will be updated.
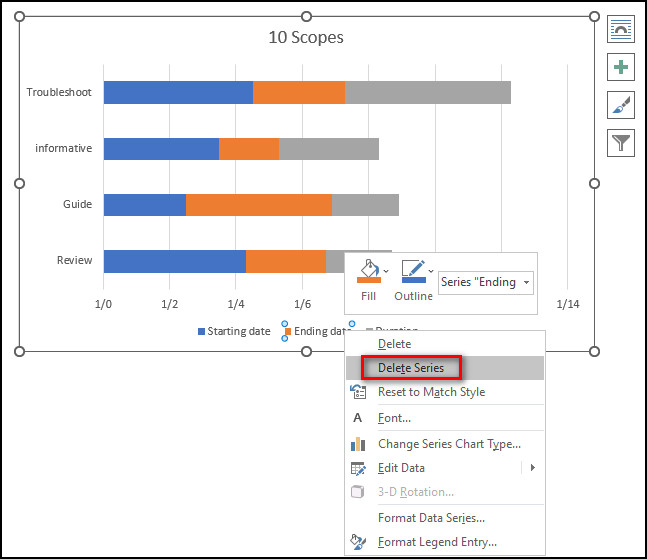
- Select the Ending date Legend at the bottom of your chart, right-click on it and choose Delete Series.
Read more on how to Fix: Find and Replace Not Working On Microsoft Word.
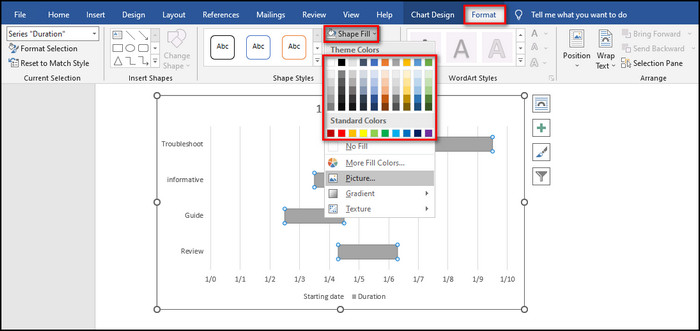
4. Convert the Stacked Bar into Gantt Chart
You finally make the Gantt chart at this point. The chart is already created. You just have to tweak the color so it looks like a Gantt chart.
Here’s how to turn the Stacked Bar into Gantt Chart:
- Click on any blue bars, i.e., Starting date of your graph.
- Go to the Format tab.
- Select Shape Fill and choose No Fill.
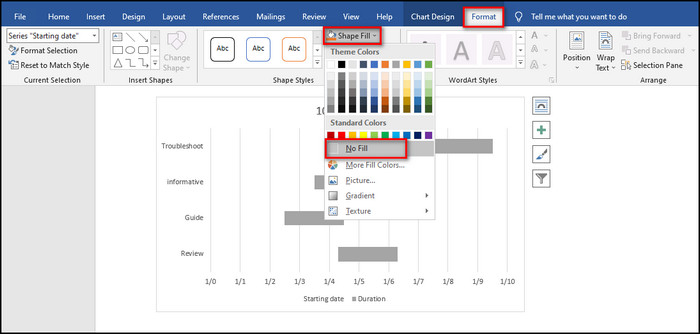
That’s it. After these steps, your Gantt chart is complete. But it looks pretty boring.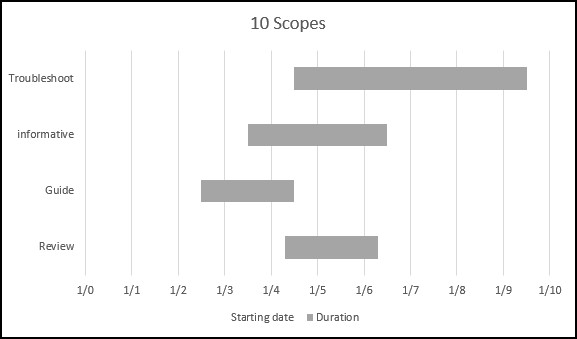
In the next section, I’ve explained different ways to modify and style a Gantt chart.
How to Change a Gantt Chart as You Like in Word
The Gantt chart is already pretty easy to understand. But if you could make it simpler all while beautifying it, why not do it? You can customize the color, change the shape of the bars, and get rid of legends to make it more straightforward.
Here’s how you can customize your Gantt chart:
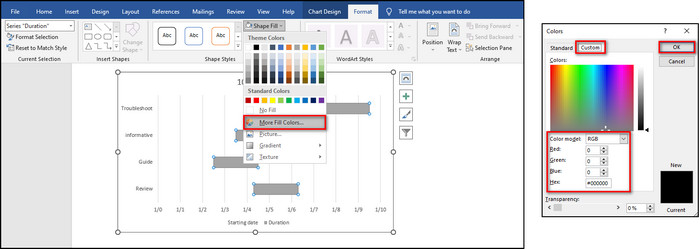
1. Change the Taskbar Colors
You can customize the color of the task bars and give different colors to different tasks. You can select a pre-made color or make your own color using RGB or Hex values.
Here are the steps to customize the taskbar color:
- Select any task on your Gantt chart.
- Go to the Format tab.
- Select Shape Fill and choose the color you want or select More Fill Colors; select Custom and provide the RGB value or the Hex code of the color you like.
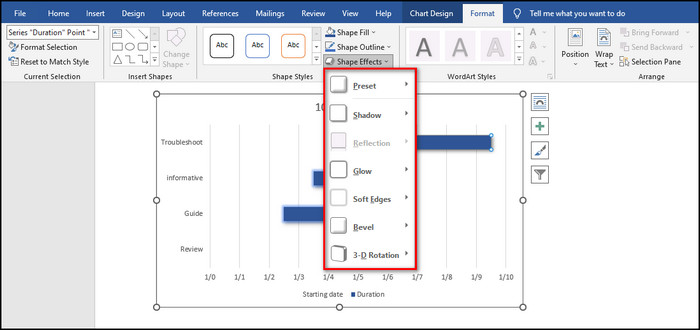
2. Change the Taskbar Effects
Modifying the task bar’s effects will make your Gantt chart stand out. You can add shadows, glows, bevels, and soft edges and further customize them to your liking.
Here’s how to add effects to the task bars:
- Select the taskbars of your Gantt chart.
- Go to the Format tab.
- Select Shape Effects and choose any effect you want.
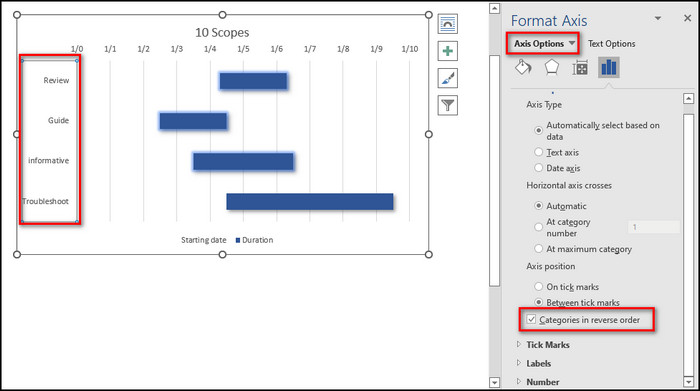
3. Change the Order of the Tasks
If you wish to customize the order of the task in your Gantt chart, well, you can, and it’s pretty easy.
Here’s the process of changing the task order:
- Select the Gantt chart and double-click on the first column, i.e., the task name column.
- Go to Axis Options.
- Select Categories in reverse order.
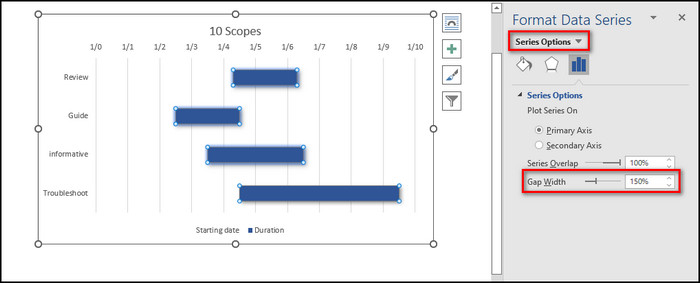
4. Change Gap Between Tasks
You can adjust the space between the task bars so that they are not crammed together, or there’s too much gap. It makes the Gantt chart look nicer and easy to understand.
Here’s how to alter the gaps between taskbars:
- Select the taskbars of your Gantt chart.
- Go to Series Options.
- Slide the scale beside Gap Width to change the space between the taskbars.
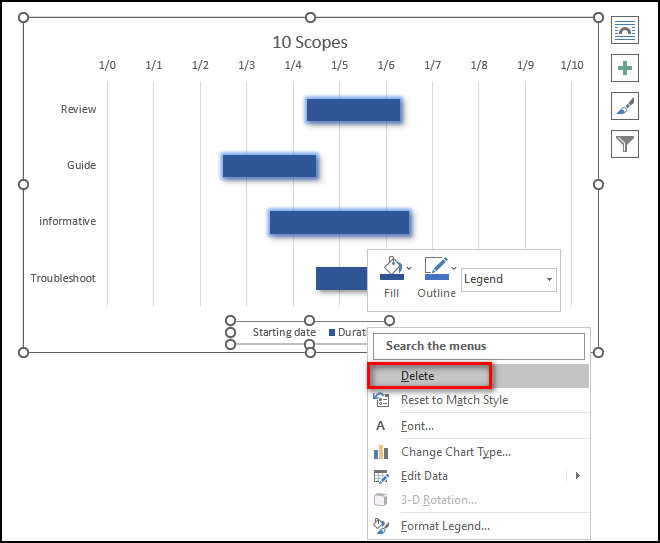
5. Delete Legends from Gantt Chart
Legends are important in a chart that has multiple components. But they are useless in Gantt charts. So it is better to remove them to make the chart cleaner.
Here’s how to delete legends from a Gantt chart:
- Select a Legend on your Gantt chart.
- Right-click on the Legend and choose Delete.
FAQs
How do you fill a color in a Gantt chart in Word?
To fill a color in a Gantt chart in Word, select the taskbars of your Gantt chart, go to Format > Shape Fill and choose a color.
Does Microsoft have a Gantt chart app?
Yes, the Office 365 Gantt Chart is a project planning app that shows and organizes tasks in the Gantt way.
How do I make a Gantt chart in PowerPoint?
To make a Gantt chart in PowerPoint manually, open a blank slide in PowerPoint, select Insert > Chart > category Bar > type Stacked Bar, insert project schedule and data into Excel and turn the stacked bar into a Gantt chart by selecting No Fill as color.
Final Thoughts
The Gantt chart is one of the best management tools currently available for organizing your projects and controlling your team members. Luckily, you can create this chart in Microsoft Word in just a few steps.
And in this article, I’ve explained just that, along with how to customize the chart to make it cleaner and easier to understand.
Let me know if you have further questions about customizing the Gant chart. See you in the comment section.