Monitoring the temperature of your CPU (Central Processing Unit) is important to ensure that it is running at a safe and optimal level. There are a few ways to tell how hot your CPU is.
So, in this article, I’ll explain how to tell your CPU temperature, why it’s high, and how to reduce it.
Let’s get started.
How do I Tell How Hot My CPU is?
There are several methods for determining how hot your CPU is, including the use of software tools such as Core Temp, HW Monitor, and Open Hardware Monitor. You may also check your CPU temperature using Windows BIOS settings and UEFI tools.
Another approach to monitoring your CPU temperatures is to use your computer’s BIOS settings.
To open the BIOS, restart your system and click a key (often Delete, F2, or F10) to launch the setup tool. To check the temperature value of your Processor, go to the Hardware Monitoring or Health Status area of the BIOS.
You can also tell your CPU temperature by utilizing Core Temp, a software program for measuring CPU temperature.
The Core Temp software displays the temperatures of each particular core in your CPU, as well as the temperature of the entire CPU unit. It is simple to operate and can be obtained for free through the internet.
Finally, if you wish to measure the temperature of your Processor with a physical device, you can buy a heat monitoring probe. These sensors can be mounted directly on the exterior of the CPU to provide a more precise temperature readout.
How to Monitor the CPU Temperature of Your Computer
A user can monitor the CPU temperature using NZXT’s Cam, Core Temp, and Open Hardware Monitor. Users can also use real-time temperature-checking software such as Real Temp and Speed Fan, which also displays the temperature of the CPU while running any application.
To demonstrate, we will use the Core Temp program to measure the temperature of our CPU. You can also utilize NZXT’s Cam, HWInfo, Open Hardware Monitor, and Speed Fan to monitor your CPU temperature.
The CPU temperature monitoring procedure is really simple. Simply follow the instructions below to know how.
Here is the method for monitoring the CPU temperature of your computer:
- Download Core Temp and install it on your computer.
- Open Core Temp application.
- Check the Temperature Readings option.
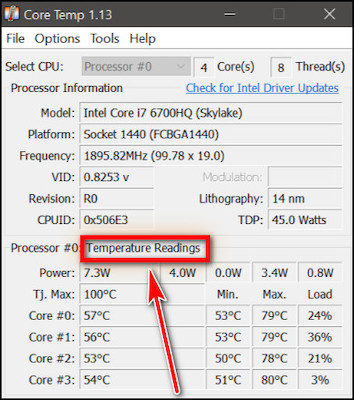
Temperature readings for each CPU core are available via the Temperature Readings option. The CPU’s core temperatures are displayed individually, as well as the processor’s minimum, maximum, and load temperatures.
If you’re wondering whether these CPU temp readings can be wrong, we’ve got you covered.
How to Check the Temperature of Your Computer While Gaming
Most gamers use RivaTuner and FRAPS to monitor their computer’s temperature while playing games. These temperature monitoring programs show the temperature of all devices as well as the usage of all components in real time during gameplay.
If you’re playing a video game in full-screen mode on a monitor, you can’t see your temperature monitoring software or toolbar to check the temperature. In fact, using ALT+TAB to check the temperature is more of a hassle than playing a game peacefully.
To overcome the overheating issue, gamers commonly use RivaTuner, a CPU temperature monitor that comes packed with the CPU boosting application MSI Afterburner. MSI Afterburner can measure your CPU temperature accurately.
Let’s look at how to check the temperature in the game using RivaTuner in the section below.
The procedure to check your CPU temperature while gaming is as follows:
- Download MSI Afterburner and install it.
- Open MSI Afterburner from the desktop shortcut.
- Go to the Settings icon and choose the Monitoring tab.
- Select CPU temperature from the list.
- Active On-Screen Display by clicking on the tick button beside it.
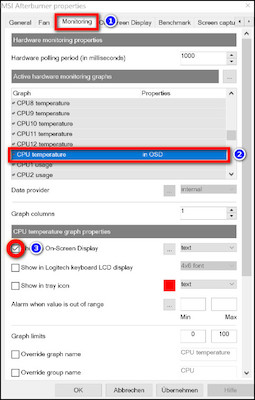
After activating the on-screen display, launch a game. While playing the games, you can observe your CPU temperature in real-time.
How to Continuously Check the Temperature of Your CPU
Core Temp, NZXT CAM Software, and AIDA64 Extreme are commonly used by users to continually monitor the temperature of the CPU while working with demanding applications. The temperature is displayed in the taskbar portion of these applications.
When users utilize intensive software for video editing or rendering, such as 3D Studio Max, Blender, and Adobe Premier Pro, they must monitor their CPU temperature.
Users can accomplish this by using Core Temp, which displays the CPU temperature in the taskbar. It resembles a tiny temperature meter on your taskbar. Learn how to utilize the Core Temp software in the section that follows.
Here’s how to constantly check your computer’s temperature:
- Download Core Temp and install it in your system.
- Open Core Temp.
- Left-click the arrow in the notification area of your taskbar.
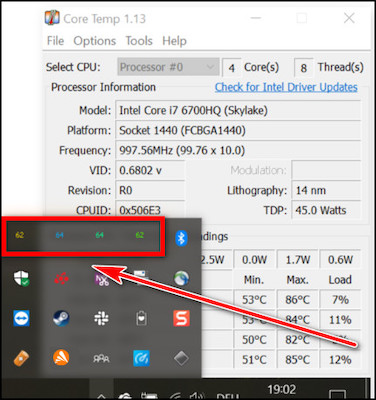
Note: In the Taskbar, you can see four core temperatures in different colors.
- Click and hold each number and drag it to your taskbar to pin it.
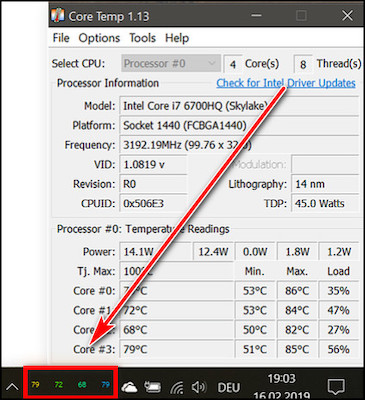
After pinning it to the taskbar, you can check your CPU temperature in real-time while rendering or editing video.
Why Should I Monitor the Temperature of My CPU?
You should keep an eye on the temperature of your CPU to avoid overheating and unexpected system shutdowns, as well as to decrease performance throttling. To minimize system instability concerns, crashes, and long-term damage, you should also check the temperature of your CPU.
When you overclock your graphics card, its temperature will surely rise. To avoid long-term GPU damage, you must monitor its temperature.
Suppose, if you have a super-thin Ultrabook, it has less space for cooling. Since it can get very hot during hard work or gameplay. So keeping an eye on its temperature can help you get the most out of it.
Additionally, your computer might even shut down when the CPU temperature is excessively high.
Finally, if you haven’t cleaned your PC in a long time, dust might accumulate inside the computer case, slowing or even blocking the fans.
As a result, your CPU’s temperature may rise and cause harm. Keeping an eye on the temperature will lessen the chances of harming the CPU.
What is the Typical CPU Temperature & How Can You Reduce it?
In general, a typical CPU temperature of 35–70 °C (or 95–158 °F) is regarded as a safe level for regular activity. Cleaning the dust, making more room for cooling, and replacing damaged cooling-related hardware can all help lower the temperature.
If the temperature of your processor rises above 70 °C during a regular workload, you must act immediately. You must clear the dust off your desktop or laptop with a blower, paint brash, and rubbing alcohol.
You should also disable background processes and close apps that use a lot of CPU power. But before that, know how hot can a CPU run so that you can take necessary measures at the right time to resolve CPU overheating.
Simply open the Task Manager and navigate to the Processes tab. Select the unnecessary programs in the Process tab and disable them by clicking the End Task button in the lower right corner.
Last but not least, you can repair damaged cooling components such as a cooling fan, radiator, or the liquid inside the radiator to lower your CPU’s temperature.
FAQs
How to check CPU temperature in Windows 10?
You can check the CPU temperature in Windows 10 by utilizing third-party software such as HWMonitor, Open Hardware Monitor, HWiNFO, and Core Temp. You can also use the Windows BIOS settings and UEFI utilities that come with the operating system.
What CPU temp is too high?
Temperatures above 90 degrees Celsius or 194 degrees Fahrenheit are considered too high for the CPU.
What is normal CPU temp while gaming?
When playing games, a temperature of 142° F to 164° F (61° C to 73° C) is considered normal.
Conclusion
It’s important to monitor your CPU temperature to ensure that it is not overheating, which can cause damage to your system and lead to performance issues.
So, in this article, I demonstrated how to determine your CPU temperature, the cause of overheating, and how to reduce it.
If you have anything in mind about this topic, feel free to comment in the section below.


