Choosing the right CPU amidst bazillions of SKUs from different generations is nothing short of finding a needle in the desert.
Well, me and my team here at 10scopes, however, tested hundreds of processors from 3 consecutive generations of both Intel & AMD and ranked them based on single core, multicore, gaming, and other performance-evaluating parameters.
So, without wasting a second, let’s explore CPUs in a lot of detail.
Parameters to Sort CPU
CPU ranking is done on a performance basis. Don’t forget about pricing, by the way. But to determine the most powerful processor, performance factor always prevails.
Now, how do we get a fresh perspective? Well, numerous applications are readily accessible to measure CPU performance.
One caveat though — with such a high volume of CPU numbers, it’s far out to measure individual parts’ performance in every single program. Luckily, we have synthetic benchmark software solutions that replicate the real-world performance of these processors in applications we use without cessation.
That said, we assessed every processor’s Single Core, Multi-Core, Productivity, Gaming, and Efficiency behavior. These are the aspects you need to look into before picking up a CPU, nevertheless.
The Test Bench
Intel 11th, 12th, 13th, and AMD Ryzen 3000, 5000, 7000 series CPUs are our pick to establish a performance pyramid, as these parts are the newest and widely available in the market.
Only the CPU won’t cut it, right?
So, we set up completely different test rigs to carry out the benchmarks. Each platform has its own SSD; not a single one is shared between two test benches, such as AMD or Intel, to steer clear of any sort of driver conflict.
To be on the safe side, we installed separate OS drives for AM4, AM5, LGA 1200, and LGA 1700. So that even the chipset drivers can cause any stability or performance issues.
Below you’ll find the specification for the test benches of Intel and AMD platforms:
| Intel | |||
|---|---|---|---|
| Components | Intel 13th Gen (Raptor Lake) | Intel 12th Gen (Alder Lake) | Intel 11th Gen (Rocket Lake) |
| Motherboard | ASUS ROG Strix Z690E | Aorus Ultra Durable Z590 | |
| RAM | G.SKILL Trident Z5 RGB Series 32GB (2 x 16GB) 6000Mhz DDR5 | Crucial Ballistix 3200 MHz DDR4 32GB (16GBx2) CL16 | |
| SSD | SABRENT 1TB Rocket 4 Plus NVMe 4.0 Gen4 PCIe M.2 | ||
| OS | Windows 11 | ||
| GPU | ASUS TUF GeForce RTX 4090 OC | ||
| PSU | Be quiet! Dark Power 13 1000W, 80 Plus Titanium Efficiency, ATX 3.0, PCIe 5 | ||
| AMD | |||
|---|---|---|---|
| Components | AMD Ryzen 7000 (Zen4, Raphael) | AMD Ryzen 5000 (Zen3, Vermeer) | AMD Ryzen 3000 (Zen2, Matisse) |
| Motherboard | ASUS ROG Strix X670E-A Gaming WiFi 6E Socket AM5 | MSI MPG X570 Gaming Pro Carbon | |
| RAM | Corsair Vengeance RGB DDR5 32GB (2x16GB) 5600MHz C36 | CORSAIR Dominator Platinum RGB 32GB (2x16GB) DDR4 3600 | |
| SSD | Samsung 980 Pro 1TB PCIe 4.0 | ||
| OS | Windows 11 | ||
| GPU | ASUS TUF GeForce RTX 4090 OC | ||
| PSU | Be quiet! Dark Power 13 1000W, 80 Plus Titanium Efficiency, ATX 3.0, PCIe 5 | ||
Single Core CPU Ranking
Everyday tasks like gaming, photoshop, browsing, and such workloads are heavily dependent on the single-threaded performance of a CPU. Not to mention, the overall smoothness and snappy experience. All of these emerge from the IPC (Instruction Per Cycle) and clock speed improvement in each generation.
Cinebench R23, Geeekbench 6, and PassMark are our preferred applications to regulate the ranking.
After running the tests, we made an average out of 3 results for every single processor.
Let’s see how CPUs stack up against each other in terms of single-core rating:
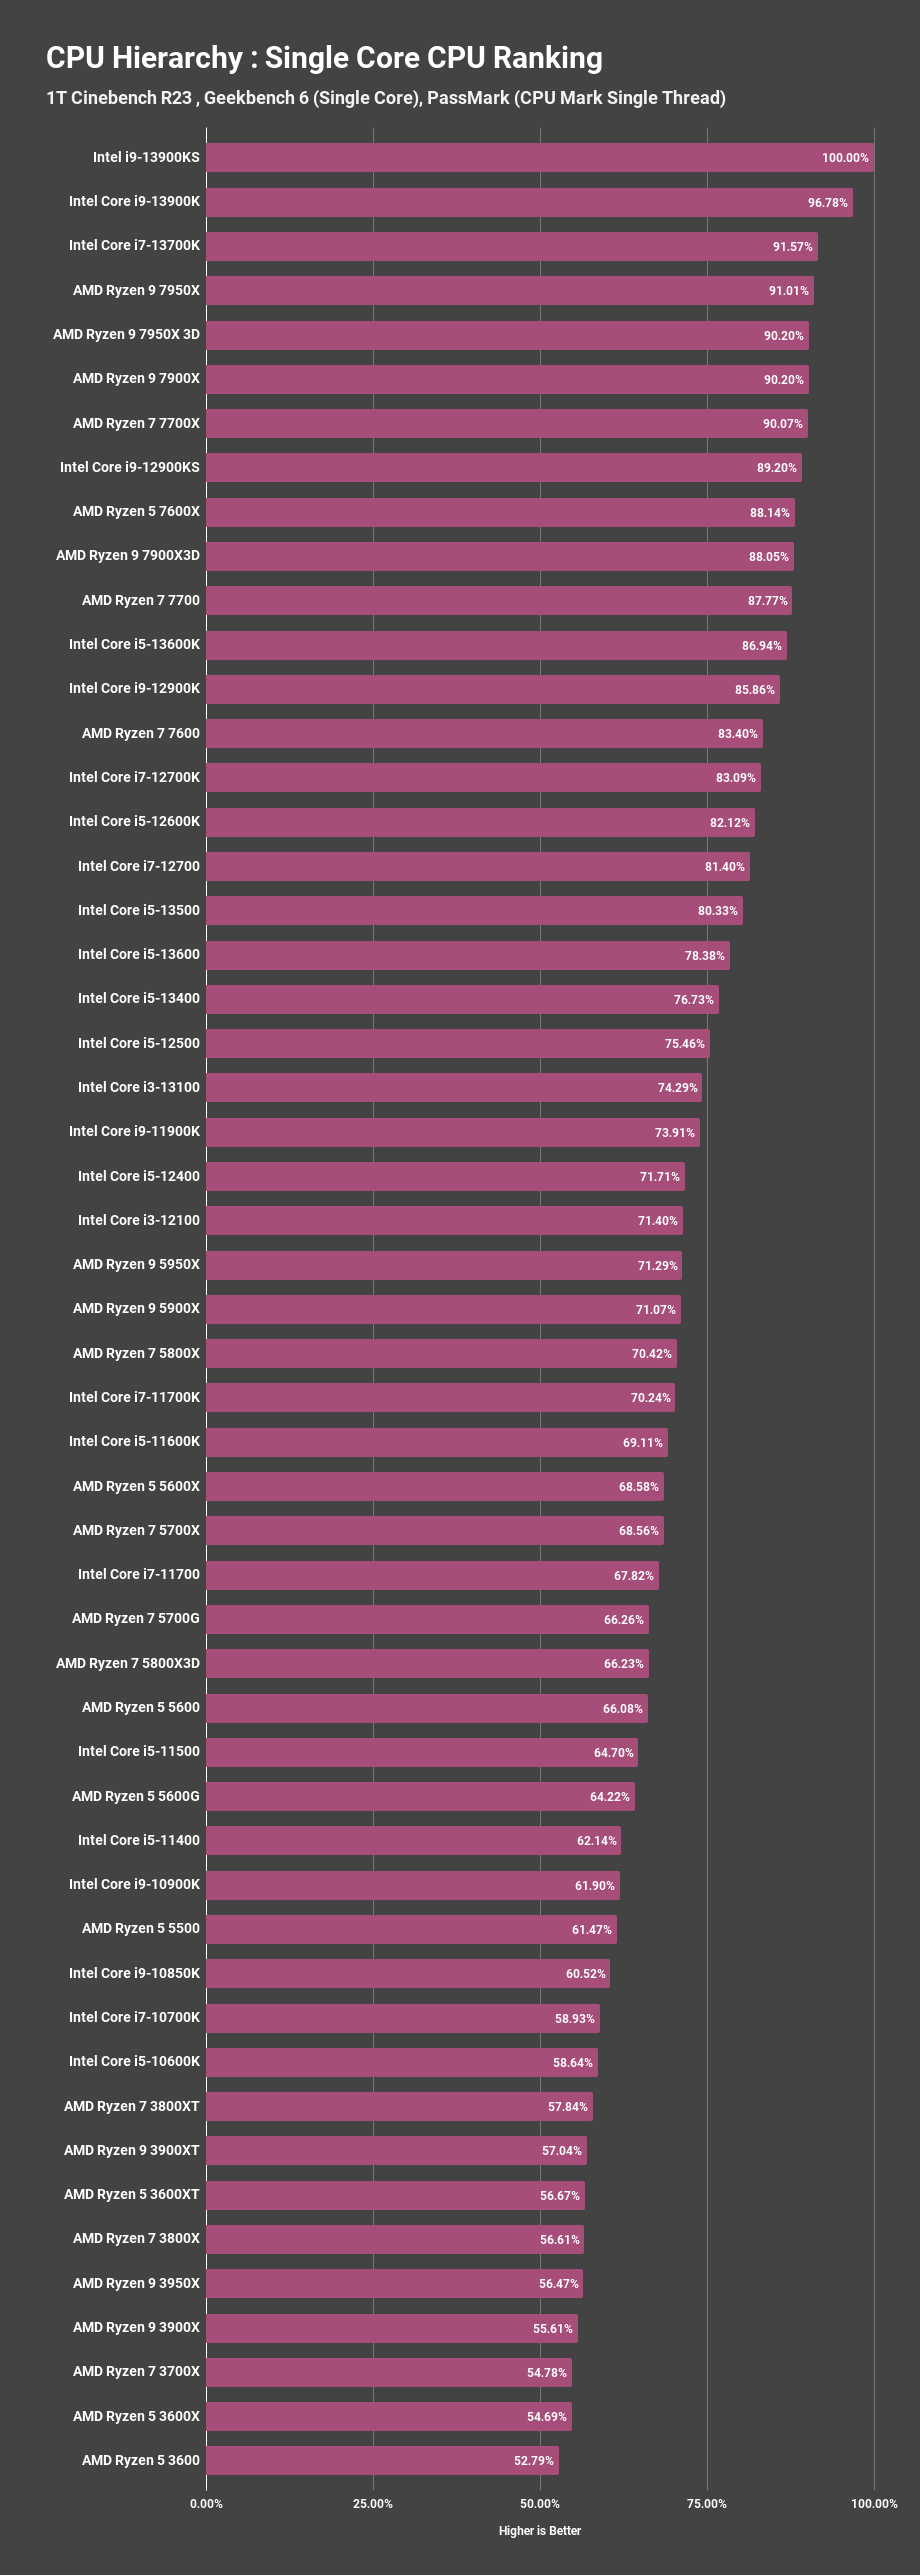
The core i9 13900KS enjoys the benefit of a record-breaking 6.0GHz boost clock and leads the single-core chart, followed by the vanilla i9 13900K, which falls behind the chart leader by a mere 3.2% in our testing.
The i7 13700K and the Ryzen 9 7950X come right after the i9 SKU being 8-9% slower.
Interesting to see is that the 3D V-cache didn’t really help AMD in terms of overall single-core performance. But any CPU that falls short between 3-5% doesn’t really make it a bad part. You can consider it as a margin of error. In reality, we experienced virtually no difference between CPUs with such a disparity.
Multicore CPU Benchmark Ranking
A CPUs multicore performance interprets how greatly you can leverage productivity applications. This is especially crucial for large studios or the content creation industry. Also, medical research and engineering fields can save huge amounts of time, which I believe is actively economically beneficial.
Just so you know, CPU architecture, IPC, core count, and frequency all come to play when it comes to multicore enhancement over a previous-generation product.
Now, have a look at the multicore CPU standings with a glance.
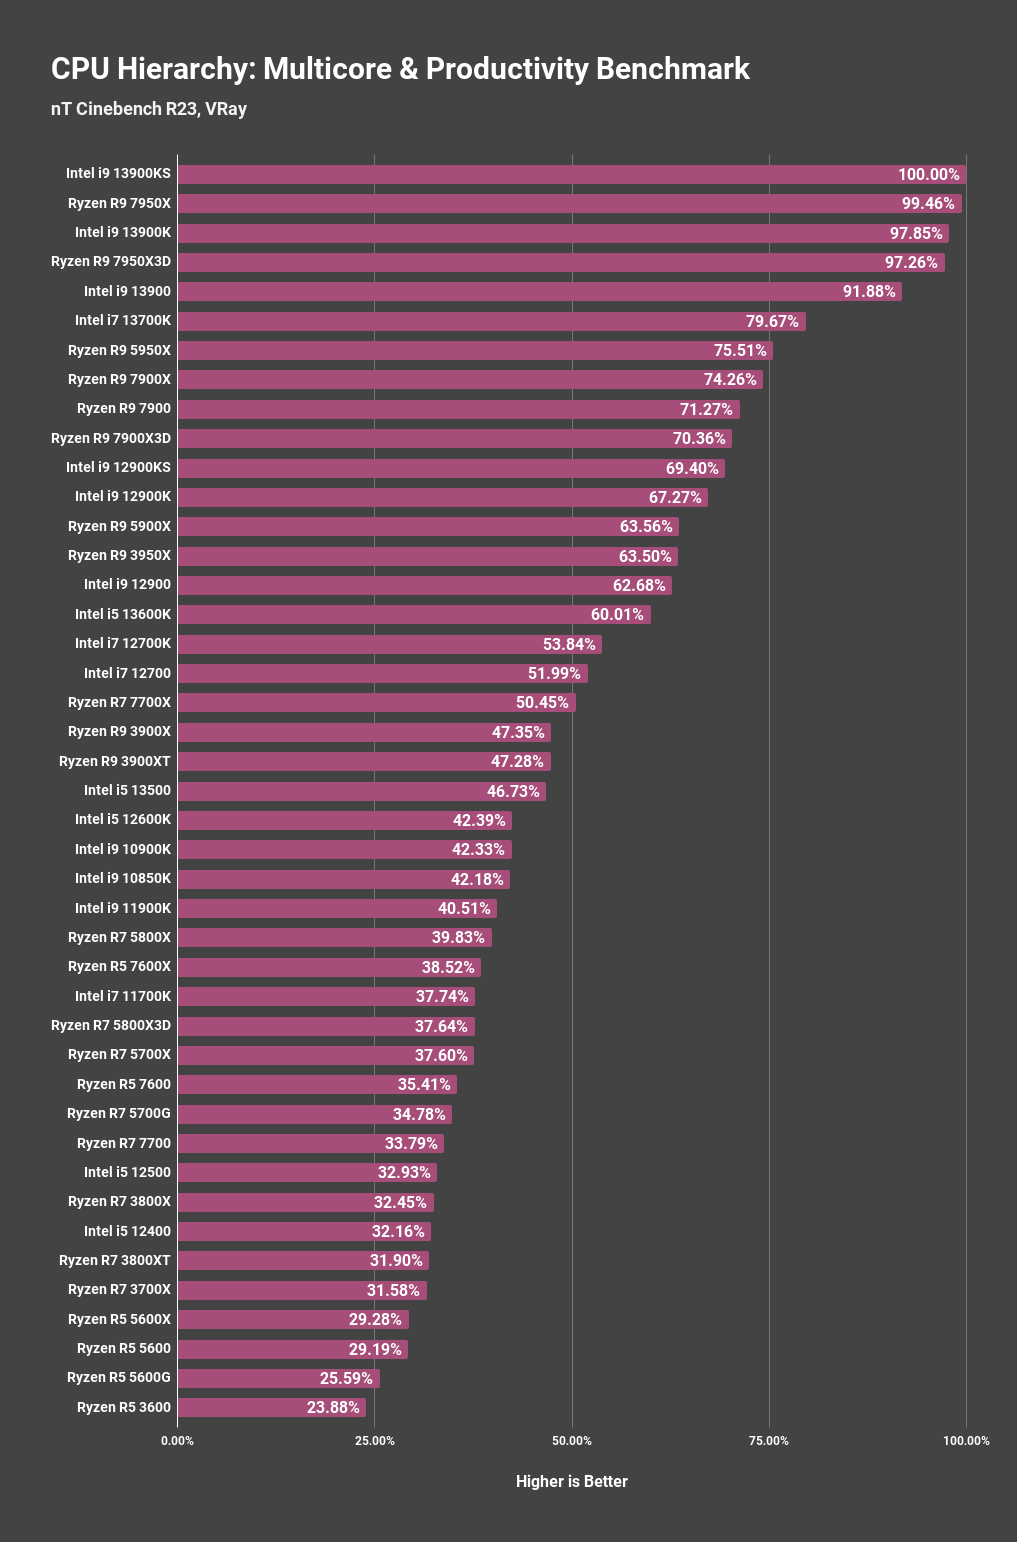
Things are quite fascinating here, as you can see. The core i9 13900KS and the Ryzen 9 7950X are almost identical, with a bare 0.5% performance deficit for the latter AMD flagship SKU. So, it’s basically a tie.
The same can be said for the i9 13900K and R9 7950X3D. To be completely honest, any CPU between these 4 SKUs is a beast when it comes to productivity. There’s nothing wrong going for either processor. 13th Gen i7 13700K and Ryzen 9 7900X, however, are one step down.
Now, for measuring the performance, we ran the Cinebench R23 and VRay 5 benchmark. Both push a CPU to its absolute limit. We rated the CPUs, deriving 100 for the best one. Others are rated relative to the chart-topper in percentage value.
With all being said, the ranking may shuffle a little bit if more applications are added to the test results. But that doesn’t mean our data will lose value, rather you’ll find them more in line with others having slight variation. That happens due to run-to-run variation.
Hierarchy of Gaming CPU
Gaming has been one of the most hyped and prestigious deciding factors for the manufacturer to pronounce its supremacy against the competition. No matter how funny it sounds, even if they can pull ahead ever so slightly, marketing and bragging are in order. Hence, we see highly binned chips like KS and X3D from Intel and AMD, respectively.
Speaking of gaming performance, it mostly benefits from IPC gain, clock speed improvement, tight memory latency, and L3 cache.
We chose CPU-intensive games to draw the best to the least-performing processors in games. Cyberpunk 2077, FarCry 6, Microsoft Flight Simulator: 2021, Cities Skyline, Total War: Warhammer III, and Red Dead Redemption 2 are our choice of titles.
Our results include 1080p and 1440p data. We calculated the mean value for each CPU. Just like the single core and multicore ranking, this hierarchy is also calculated in percentage.
Below is our gaming CPU ranking:
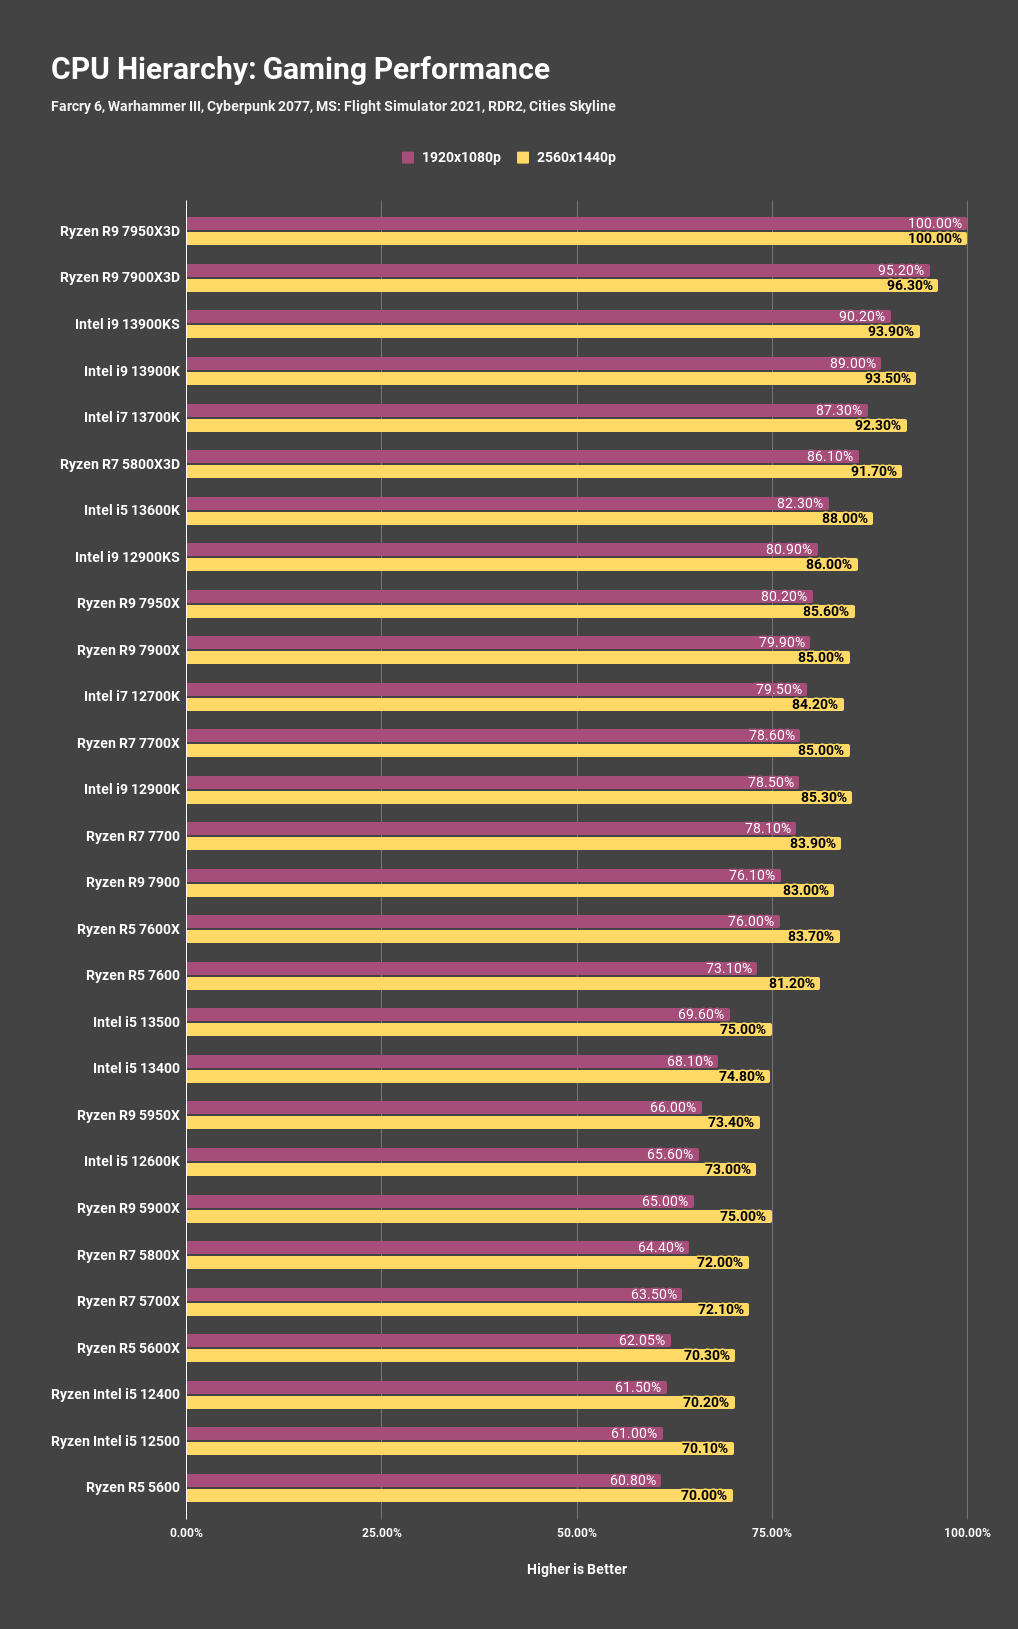
Surprisingly enough, the single-core champ i9 13900KS has now become the 3rd placeholder when it comes to gaming. The Ryzen 9 7950X3D and 7900X3D both take the first top 2 spot, respectively.
That goes without saying, when the Ryzen 7 7800X3D comes out in April 2023, it will eventually perform in line with its other two 7000X3D series siblings.
The rest of the hierarchy tree looks like 13th gen CPUs in the middle, followed by Ryzen 7000 processors. Ryzen 7 5800X3D, however, takes us by surprise and is one of the top 5 CPUs for gaming. Needless to say, one of the best value gaming processors.
Coming back to the list, due to the overwhelming amount of SKUs, we had to pick the latest generation processors into the account. But our team is working hard to add more CPUs to the gaming hierarchy list.
In this context, expect Intel 12th gen and Ryzen 5000 series to see eye to eye. But mostly, Intel chips pull ahead in games.
CPU with iGPU Performance Ranking
APUs have gained a lot of attention in recent years, especially because of their impressive iGPU performance. These parts almost kill the necessity of an entry-level GPU for gaming or other work.
Though, due to the power split between the iGPU and the CPU core, they mostly reside at the bottom half of the hierarchy list in terms of raw performance. Newer core architectures, however, close this gap quite a bit.
So, we rated APUs separately. But our test excludes any Mobile APUs such as 6800U, 6600H, etc.
Following are the performance standings of available desktop APUs:
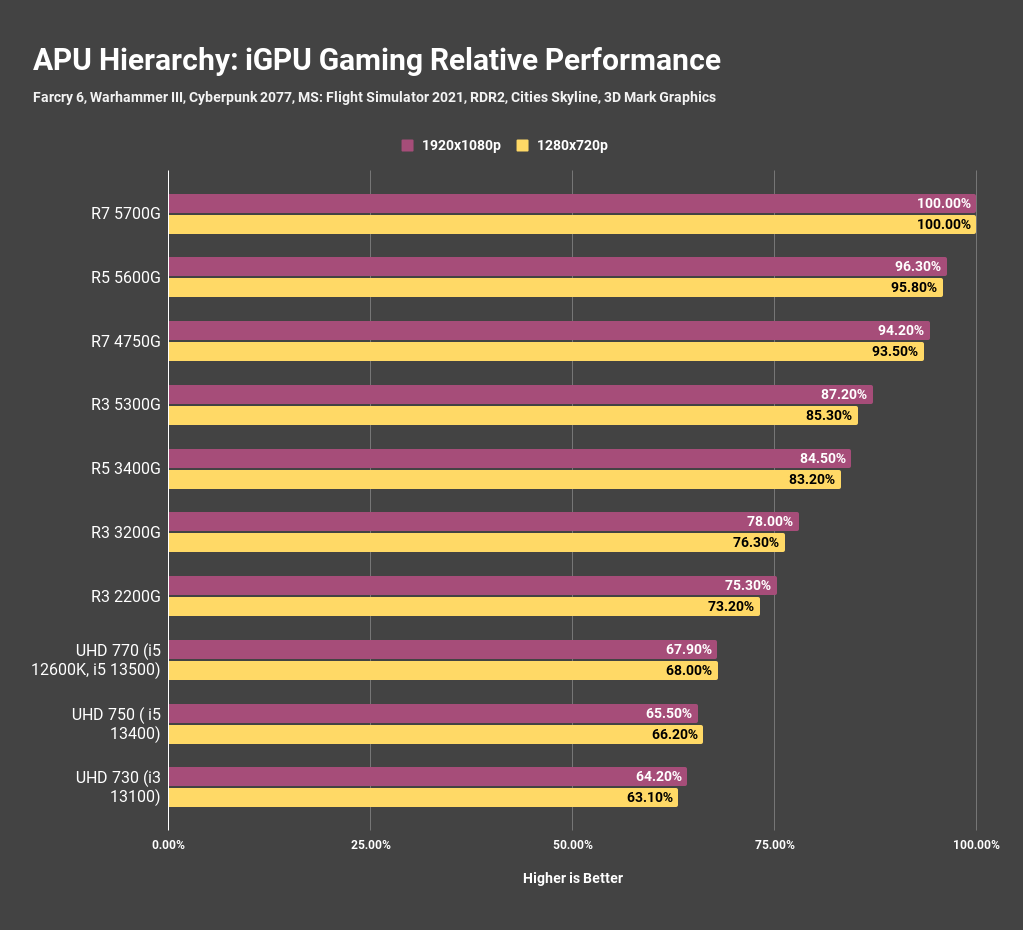
Ryzen 7 5700G sits at the top of the tree, thanks to Zen 3 cores and Vega 8 iGPU. Ryzen 5 5600G and last generation Ryzen 7 4750G place themselves firmly in the hierarchy ladder, respectively.
As expected, AMD’s superior graphics architecture reigns the APU performance chart, despite being on the aged Vega iGPU. This makes Intel UHD discover a place at the bottom of the ranking.
CPU Ranking Based on Efficiency
As microarchitecture evolves, manufacturers allow the chips to draw as much power as possible to maximize performance. This is effective in edging out the competition, even if the margin is narrower than a needle’s loop.
Such practice is not necessarily a good thing, rather puts a greater number on paper with caveats like heat and CPU throttling. So, we took the liberty and ranked CPUs according to their performance against each watt consumed.
In our testing, we put through the chips in Cinebench R23 all core load and observed the average power usage coupled with performance.
First, let’s look at the power consumption of the chips we tested:
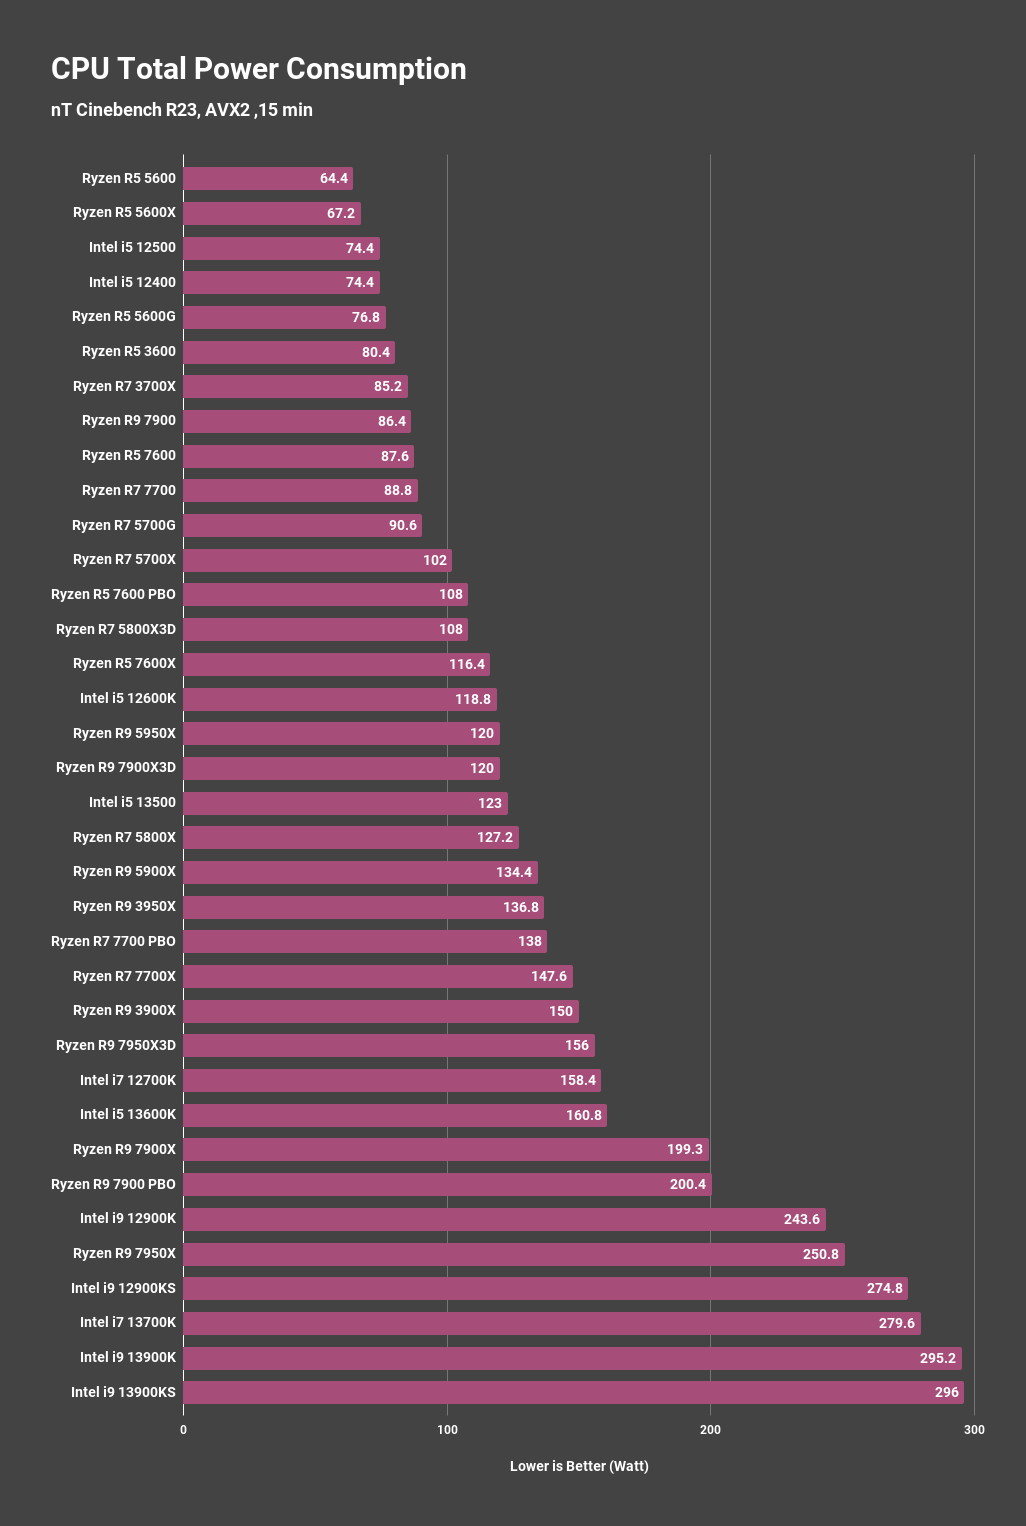
The i9 13900KS and 13900K pull the maximum wattage out of any mainstream desktop CPU we ever tested, engulfing 295W of power. AMD’s counterparts, however, enjoy comparable performance gripping significantly lower power.
Now, comes the exciting part, and here’s what the performance per watt looks like for these processors.
Below is the CPU hierarchy based on performance per watt:
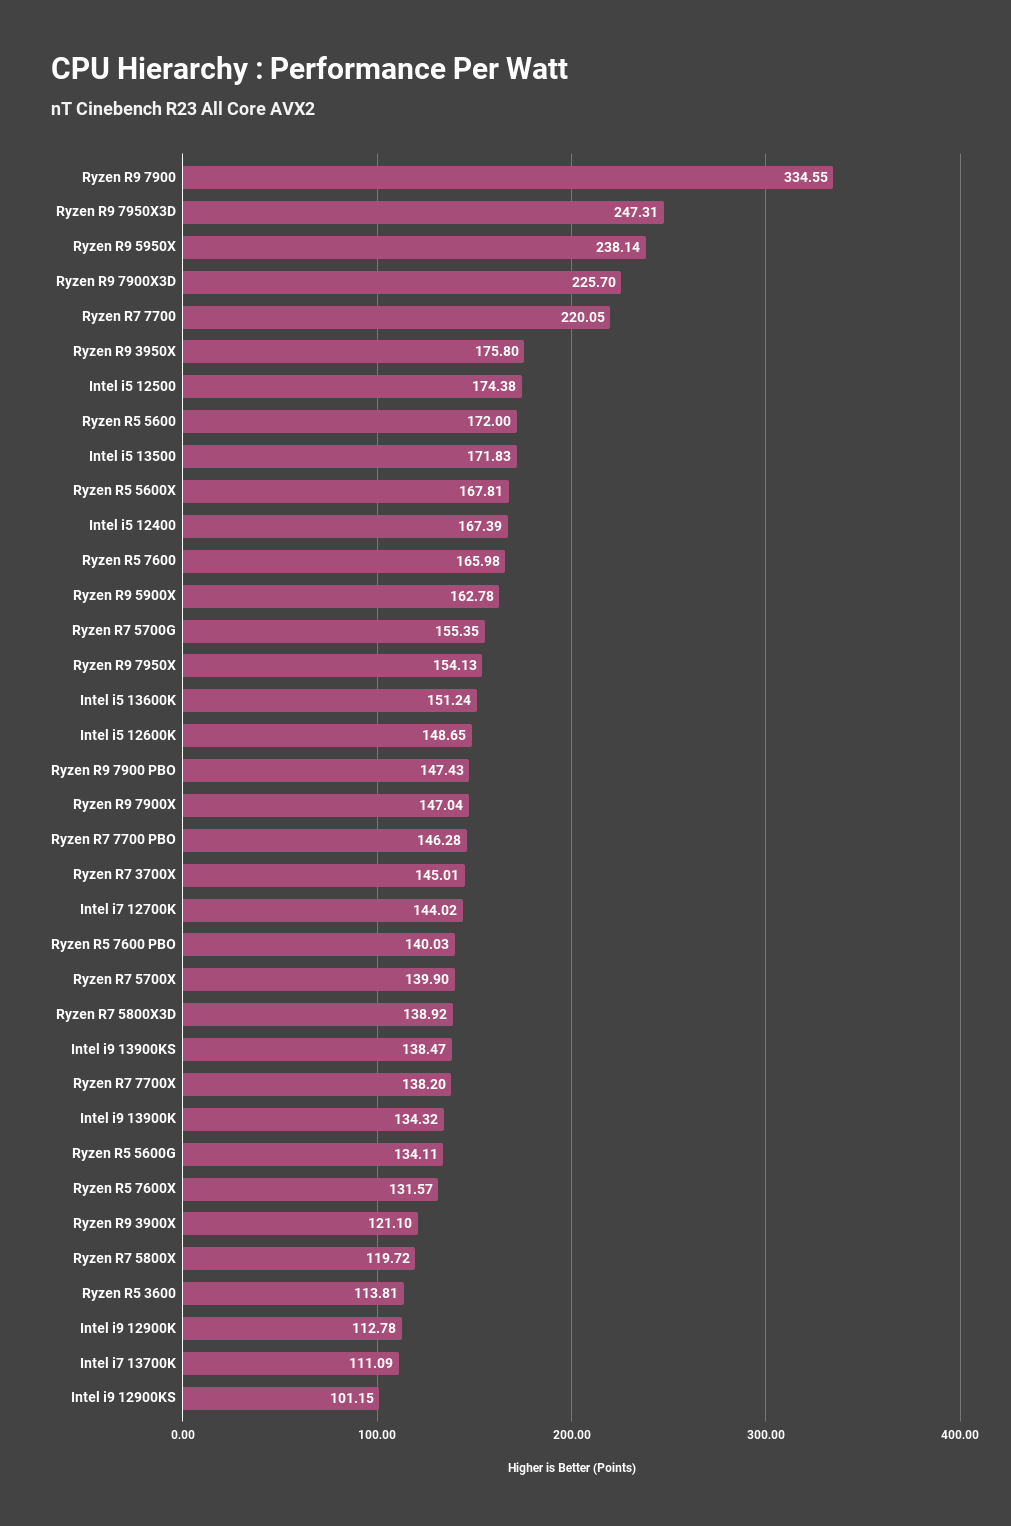
The non-X Ryzen 9 7900 excels by a long shot. The performance it yields using this level of power is phenomenal. The previous efficiency champion Ryzen 9 5950X find its position in 3rd place, shy of the efficiency leader by almost 100 points in performance per watt rating.
The brand new Ryzen 9 7950X3D performs exceptionally well and boasts position 2. Which is 180 degrees turn from the vanilla 7950X’s disappointing power profile despite being built on TSMCs supper efficient 5nm FinFET process.
Intel’s top dogs i9 13900K/KS, and i7 13700K find their place on the other side of the spectrum. But you can always tune these CPUs by undervolting them.
Tier List: CPU Hierarchy from a Different Perspective
Tier-based hierarchy helps to group any component. And CPUs are no exception. Different SKUs are priced differently and targeted to a particular customer segment. We already covered the performance aspect of 3 generations of Intel and AMD processors.
Important to note our tier-based hierarchy is backed by the last 2 generations of Intel CPUs. Owing to this fact, Intel introduced big little cores with their 12th-generation processors. That shifted the product stack quite unexpectedly.
We no longer can match like for like an i7 with an R7 SKU due to core count dissimilarity. The same thing goes for i5 and R5 product SKUs. For instance, both the i7 and R7 used to be an 8C, 16T part. But Intel added 4 more efficiency or little cores along with the regular 8 performance cores on the i7 12700K CPU. So if you’re thinking of getting a CPU upgrade, things are a bit more convoluted than ever.
Just within a generation, they added 4 more efficiency cores to the 13th gen i7 CPUs. This is no match for Ryzen 7 counterparts as they are still 8C &16T going against 16 cores (8P + 8E) & 24 threads competitors.
So after considering the price, specs, and performance, we arranged these CPUs.
In this section, I will shed some light on segment-wise CPU ranking.
Follow the table below:
| Segment | Intel | AMD |
|---|---|---|
| Tier S - Ultra High-End | i9 13900KS/K/KF | R9 7950X/3D |
| Tier A - High-End | i7 13700K/KF | R9 7900X 3D |
| i9 12900K/KS/KF | R9 7900X | |
| R9 7900 | ||
| R9 5950X | ||
| Tier B - High-Mid-End | i5 13600K | R7 7700X |
| i7 12700K | R7 7700 | |
| R9 5900X | ||
| R9 3950X | ||
| 5800X3D | ||
| Tier C - Mid-End | i5 13500 | R5 7600X |
| i5 12600K | R5 7600 | |
| i5 13400/F | R7 5800X | |
| R7 5700X | ||
| R7 5700G | ||
| Tier D - Low-Mid-End | i5 12500 | R5 5600X |
| i5 12400/F | R5 5600 | |
| R5 5600G | ||
| Tier F - Entry-Level | i3 13100 | R5 5500 |
| i3 12100 |
Ending Remarks
CPU hierarchy list is not permanent. With every new generation of products, this roster will change. So we’ll be adding more data and keep updating the performance charts.
Until then, use our hierarchy charts and choose the best CPU according to your need and preference.
Happy PC building!